Transform Smart Building Data into KPIs That Matter
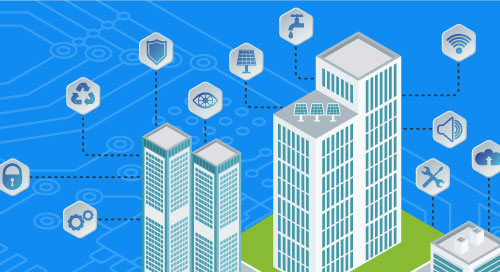
Consider a smart building. Let’s say it’s a department store in Ohio. A facility manager notices that energy consumption is 17 percent above average this winter.
At first glance, one could chalk up the unseasonably high utility bill to an unseasonably cold month. But upon further analysis of the building’s operational data, the facility manager learns that the rooftop HVAC unit’s economizer damper is malfunctioning and needs to be repaired. After a quick fix, energy costs return to normal.
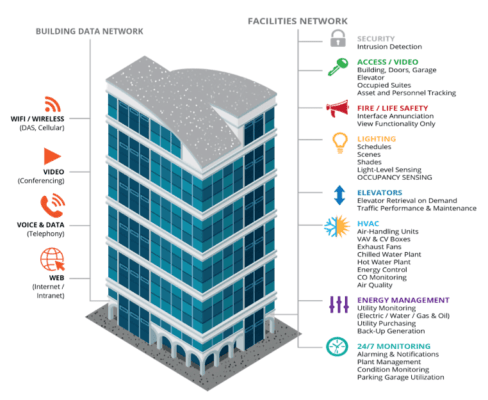
While this may sound simple, it’s not. Yes, by connecting HVAC, lighting, energy, and other systems to an intelligent, centralized control platform, building automation systems can help maximize efficiency and reduce costs (Figure 1). But capitalizing on this infrastructure means extracting data from disparate subsystems, aggregating it, and then drawing actionable correlations.
The simple scenario described above is possible only after overcoming some complex technical obstacles:
- Data Extraction: Most of the different endpoints and devices that comprise a smart building communicate using different protocols. Still, they must integrate with a single, unified smart building analytics platform.
- Data Aggregation: Once captured, data must be normalized, but each smart building system might generate data in different formats, structured or unstructured, time-series or relational, or data with different values (kWh versus ºF/ºC, for example).
- Data Analytics: Analytics must be applied to transform normalized data into useful information. Unfortunately, most analytics platforms were purpose-built for specific domains or functions, and are too narrow for general-purpose use cases like smart buildings.
And all of this needs to be implemented with key stakeholders in mind. More often than not, IoT data analytics infrastructure emphasizes capturing the data but does not focus enough on who might use that data, and how.
“Being able to apply analytic algorithms to your data allows you to detect trends leading to failure, or a loss of performance that might as well be failure,” explains John Petze, Co-Founder of SkyFoundry. “But if you’re in your office and it’s 85 degrees, you don’t care that the AC is still blowing. Technically, it hasn’t failed completely, but it’s failed for you.”
Application-level analytics eliminate the need for building operators to go fishing for indicators in a sea of data. @SkyFoundry
Data Analytics: Moving from Capture to KPI
SkyFoundry, a provider of IoT software development tools, designed its SkySpark analytics platform for smart buildings to help owners and operators implement and capitalize on an effective data analytics strategy. The solution employs an edge-to-cloud architecture:
At the edge, the platform provides a small-footprint software stack that can be deployed on Intel® processor-based IoT gateways and endpoints capable of running Java virtual machines (JVMs). This stack captures data from fieldbus protocols like BACnet IP, Modbus-TCP, MQTT, and OPC UA and encapsulates them in a WebSockets-based peer-to-peer protocol called Arcbeam.
In the cloud, Arcbeam transports these packets into the SkySpark multi-structured, time-series Folio database—somewhat of a cross between in-memory databases and relational databases like SQL. It is based on Project Haystack, an open-source semantic data modeling standard that provides an extensible way of tagging data from multiple sources so it can be normalized in a single database instance.
These components address the technical challenge of capturing and standardizing data from multiple subsystems in a use case like smart buildings. Now what do you do with all that data? That’s a question that IT and operations teams, especially those without a data scientist or analyst on staff, struggle with.
SkySpark solves this problem through a library of built-in analytics functions that can be used to execute rules or run algorithms against captured data. Designed for a range of industries and end use cases, these built-in capabilities can be leveraged by users with little-to-no technical expertise to transform raw data into actionable analytics.
Application-level analytics can be achieved using the Analytic Function Library, eliminating the need for building operators to go fishing for indicators in a sea of data. In fact, the platform can be configured so that indicators find the operators.
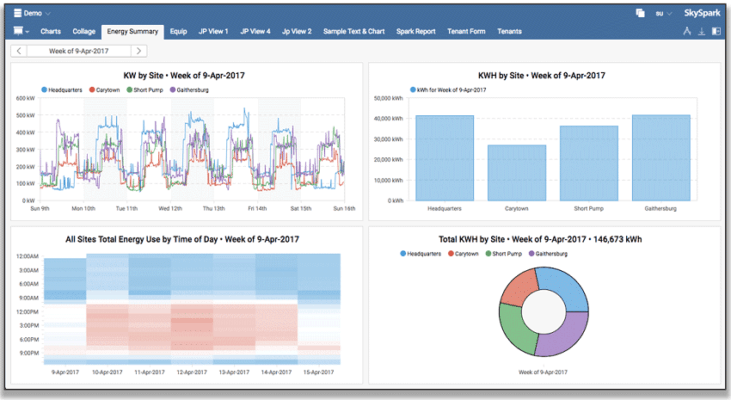
The SkySpark platform automatically generates visualizations, notifications, and reports based on data and findings from the Folio database, which are presented in customizable dashboards. The dashboards support almost any type of data in any view, and can be modified by users via the point-and-click View Builder tool (Figure 2).
Going further, out-of-the-box SkySpark Apps help users interpret and present analyzed data in ways that make the most sense for the use case at hand. A KPI app, for instance, renders points of interest as intuitive, HTML5-based presentations that are easy to consume.
Real-time data and analytical results housed within these apps can be output to third-party systems via open APIs, allowing modern, advanced IoT analytics to be integrated with existing enterprise software.
Strategy First, Data Second
Flexible analytics tools like SkySpark can be integrated on top of existing building automation infrastructure as long as the software has the performance, efficiency, networking, and security to run virtual machines and connect endpoint data to a cloud. Since Intel processor technology is already running in a variety of BAS deployments, this transition to actionable, data-driven outcomes is largely a seamless one.
As a result, organizations can focus data analytics efforts on finding the KPIs that matter to key stakeholders. But this too can be easier said than done. For example, COOs and CFOs may want to calculate the total cost of operations at different sites based on energy consumption, occupancy, repair costs, and environmental risk factors. Meanwhile, sales managers could benefit from an evaluation of weather, digital signage content, and their combined impact on in-store foot traffic.
Indeed, universal access to data can generate almost limitless analytics opportunities. In the face of renewed possibilities, the best place to start your smart building transformation is with a strategy that supports your bottom line.